

Anyone running a production needs current process data, at the system as well as on the move. Consistent quality also requires yesterday's data. Eberle connects machines, systems and sites into one overall picture, from operating staff to management, each with suitable permissions.
What we implement
Monitoring
Process and operating data in real time, locally and on mobile devices.
Alerting
Limit values with escalation levels, notification by SMS, email or call.
Operating data
Piece counts, downtimes and key figures captured automatically.
Analysis
Historical data, trends and reports at the push of a button.
3D user interfaces
Systems as a spatial model, from the overview down to the sensor.
HMI at the machine
Intuitive, safe operation even in harsh environments.
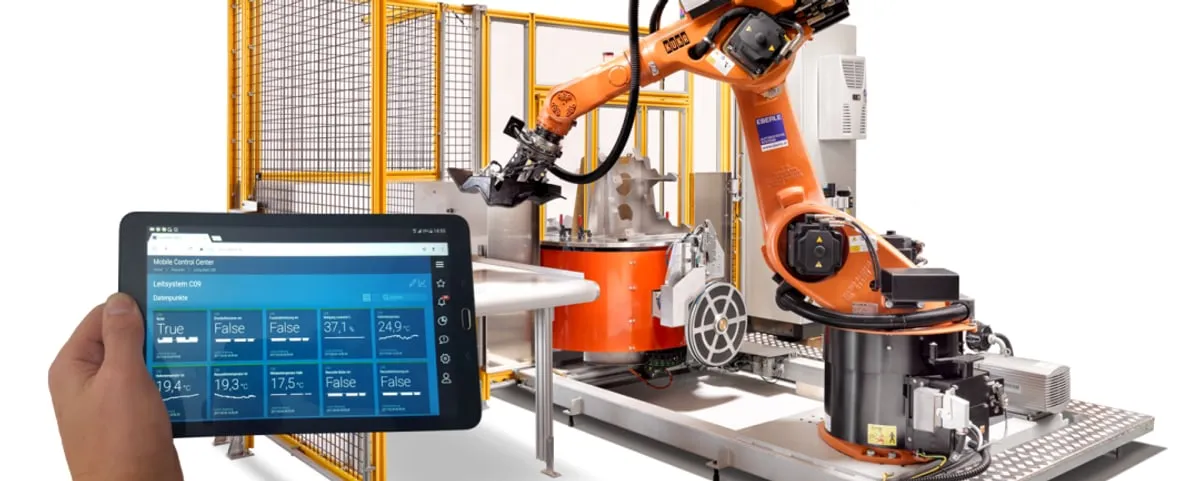
Monitoring
Our monitoring systems show current process and operating data clearly, from a single machine to a distributed plant. Several users work at the same time, and finely graded permissions control who can see and operate what.
Web-based monitoring with control runs in the browser, on desktop, tablet and smartphone, without installation. On the move, control brings the live data of your plants to the tablet.
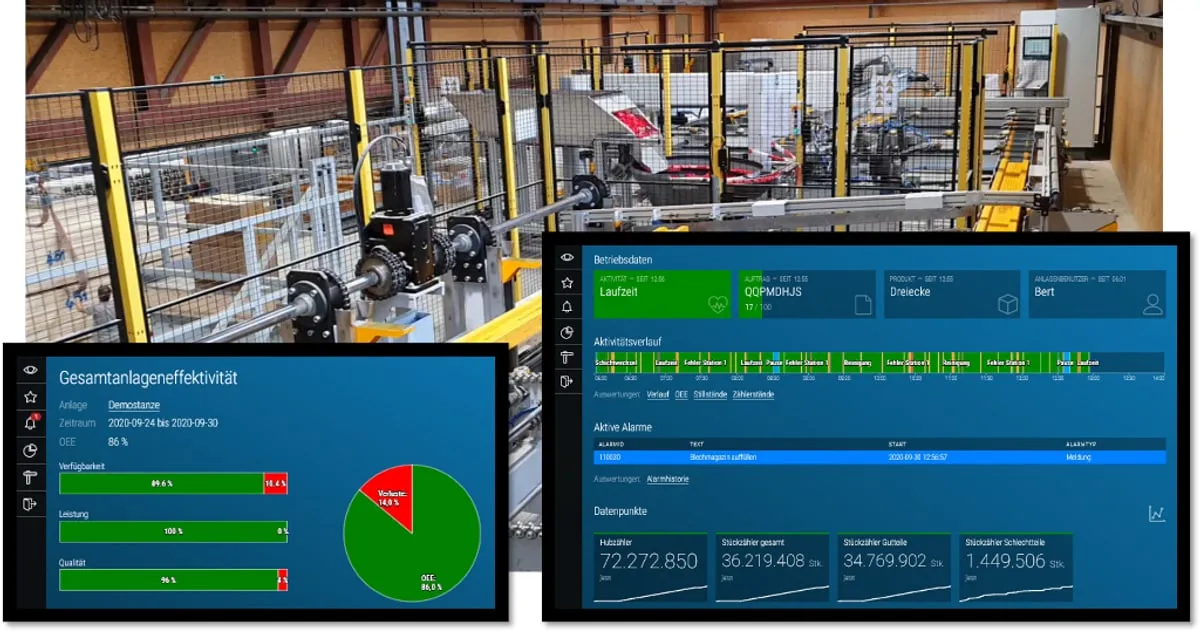
Operating data, alarms and analysis
Automatic operating data acquisition replaces estimates with actual values: piece counts, cycle times, downtimes and key figures up to overall equipment effectiveness (OEE). Shift, daily and monthly reports are created automatically.
- Alerting: limit values with escalation levels, notification by SMS, email or call.
- History: all values are continuously archived on secure servers and available around the clock.
- Analysis: trends and relationships between several measured values become visible, and improvements can be proven.
Machines without a digital interface can be integrated as well: often an IoT gateway that picks up the operating and fault indicator is enough.
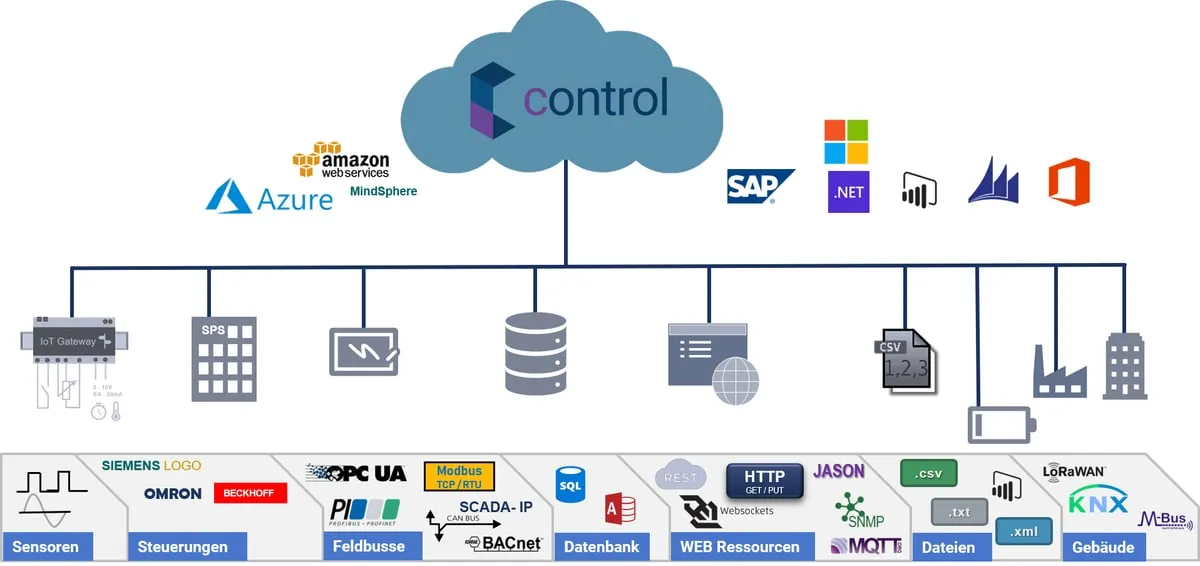
Data from all levels
For traceability, data has to flow between the levels: a manufacturing execution system (MES) connects the enterprise level (ERP) with SCADA and controllers. If the resources for an in-house system are lacking, we use remote and cloud solutions.
Connections use common industrial protocols such as OPC UA, Modbus, MQTT or SQL, secured via VPN. Building services and energy meters can be integrated as well.
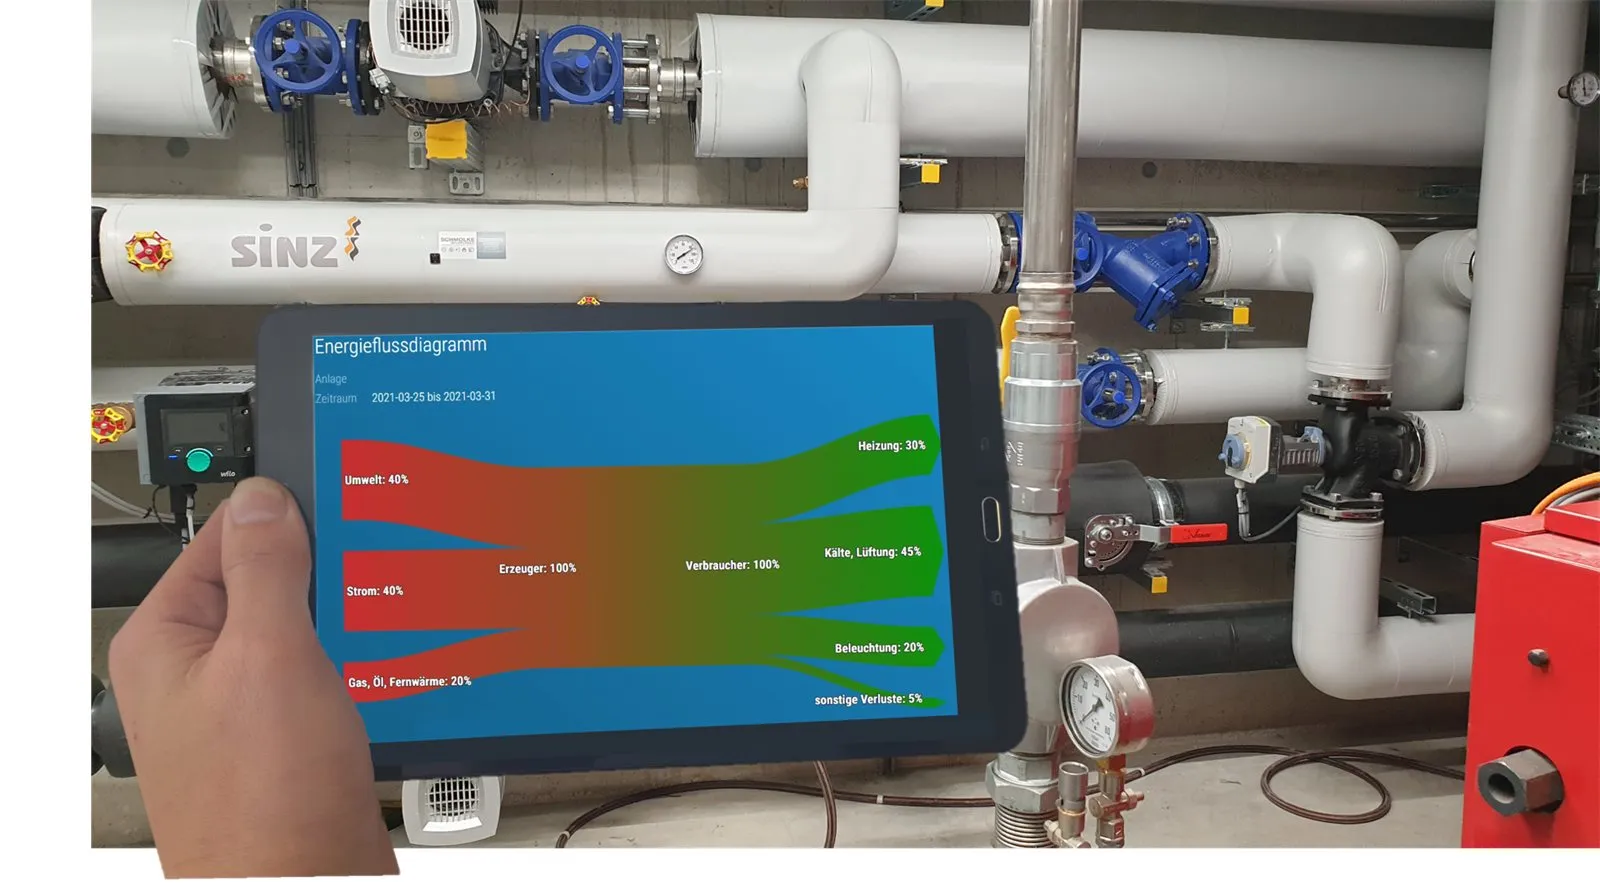
Energy monitoring
Total consumption alone does not show where energy is lost. Only measuring points at individual machines and system parts make the energy flows visible. Controllers, frequency converters or motor protection switches often already supply the values; missing measuring points are added with sensors and an IoT gateway.
If, for example, the compressor of the compressed air system keeps running at the weekend because a line is leaking, trend monitoring raises the alarm in time. Energy flows and losses become visible at the push of a button, and key figures for controlling and evidence are created automatically.
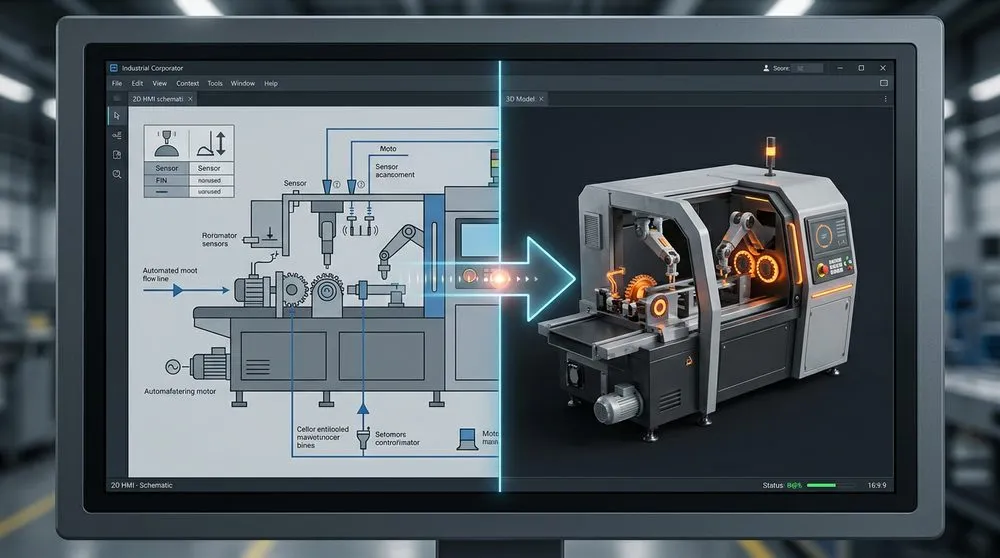
3D user interfaces
With 3D user interfaces, operators see their system as a spatial model. The level of detail ranges from the overall view down to individual actuators and sensors, with values shown in real time.
Modules for control, regulation, alarm management and trend analysis allow targeted operation. Faults are recognisable by urgency and prompt action.
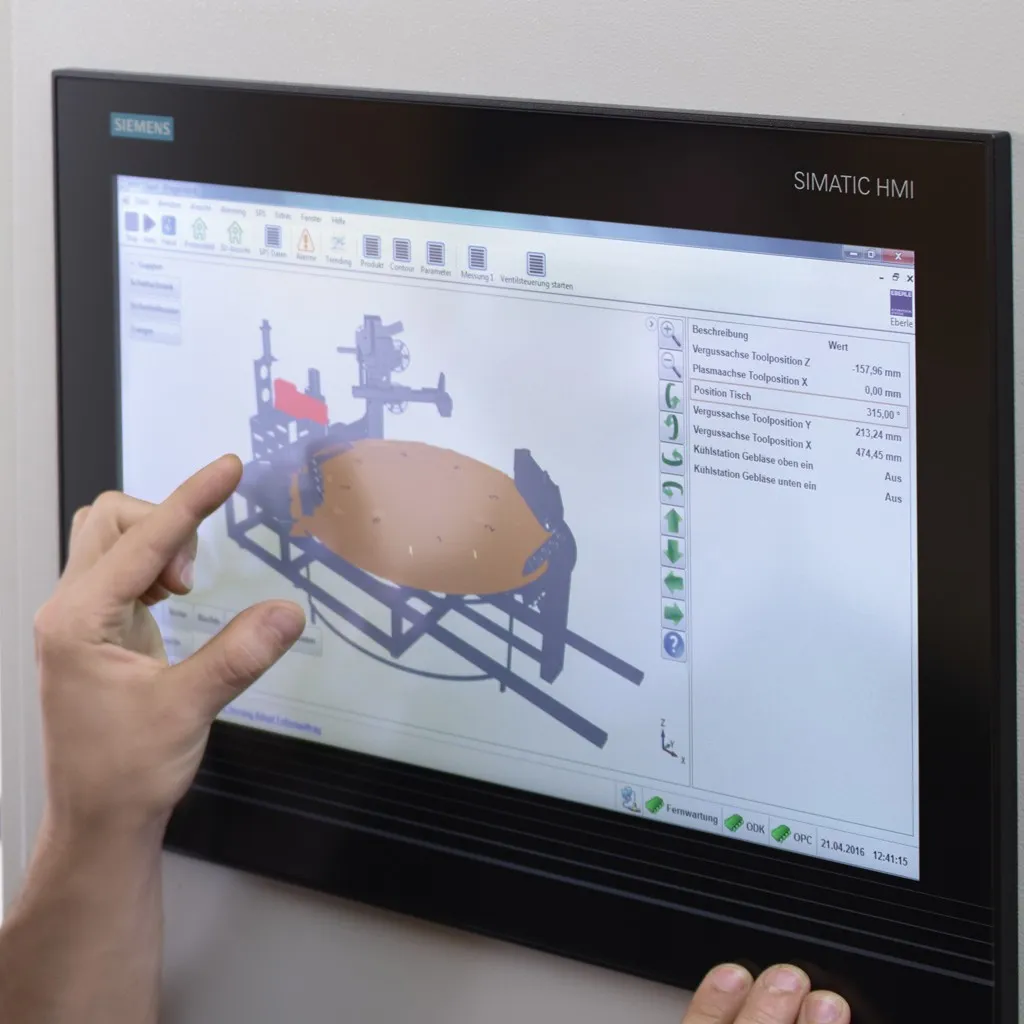
HMI at the machine
The operator panel directly at the machine is the interface for the machine operator during operation and for the technician during service. It must be intuitive and safe to use even in harsh environments and needs a permission system.
We tailor our HMI solutions to each system, built from proven modules. Connection to higher- and lower-level systems is via Industrial Ethernet.
In practice
Monitoring in use
Nesensohn small hydropower plant in Laterns
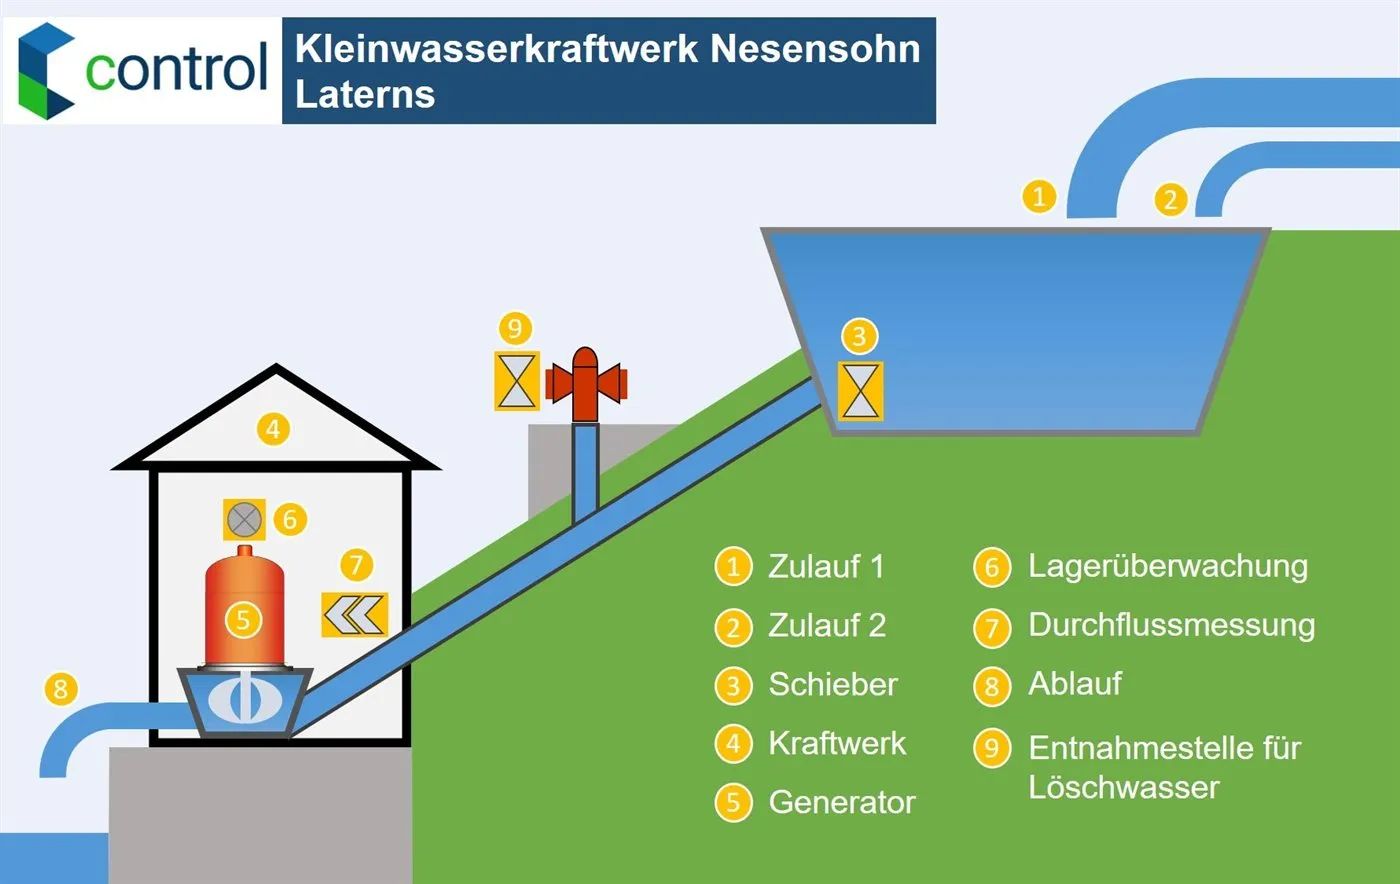
The upper reservoir and the power station are about one kilometre apart, connected by a penstock. With control, the operator keeps an eye on water levels, temperatures, gate valves, power production and camera images of all plant sections from anywhere and can intervene remotely if needed.
- Pipe burst monitoring without an additional meter: outflow at the reservoir and inflow at the power station are compared continuously.
- If the bearing temperature at the water wheel rises atypically compared with the surroundings, an alarm follows immediately.
- When firefighting water is needed, automatic messages support the controlled shutdown.
Bregenzerwald cheese cellar in Lingenau
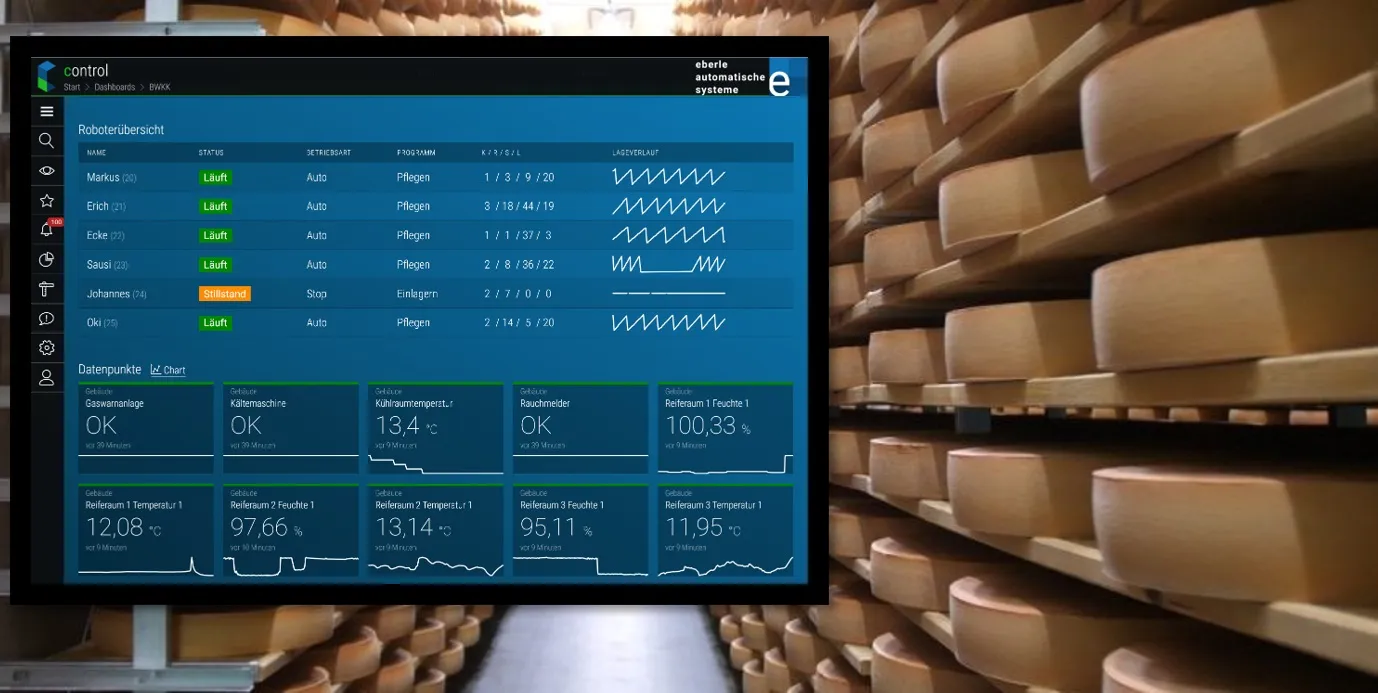
More than 32,000 cheese wheels ripen in the cheese cellar, cared for by robots. Climate, machines and storage must be monitored without gaps, at two sites. control brings together the data of three cellars, six robots and the climate and building services.
In the event of a fault or a limit violation, the cheese master is notified by SMS, email or call before quality suffers. Large screens in the cellar show the current status, and storage and batch records are available at the push of a button.
Discuss a monitoring project?
Would you like to monitor your systems or capture operating data? We will show you what is possible with your existing data sources.