

control is Eberle's IoT platform for process, machine and energy data. It collects values where they already arise today, in controllers, control systems and sensors, and makes them visible in the browser for everyone who works with them: from the operator on the line to plant management. Nothing needs to be installed, control runs as a cloud service.
The starting point
Many data sources, no common picture
In plants that have grown over the years, almost every machine has its own controller, its own panel and its own storage. The data would be there, but nobody sees it together.
- Scattered: values sit in different systems and formats, connections between machines stay hidden.
- Noticed too late: a fault only shows when someone walks past or the quantity is missing at the end of the shift.
- Calculated by hand: key figures such as OEE or energy consumption are laboriously compiled from lists.
Overview
What control does for you
Monitoring
Live values, trends and states of every connected machine, on PC, tablet or smartphone.
Alarms
Messages with history, optionally by SMS or e-mail to the person in charge.
Operating data and OEE
Quantities, cycle times and downtimes straight from the controller, with OEE calculated continuously.
Data capture at the terminal
Order and quality data that no controller knows are entered digitally by staff.
Key figures and reports
Statistics over any period, as a web report in the browser or as a CSV file.
Energy data
Consumption per machine or plant section, so that savings potential becomes visible.
Monitoring
Mobile with control: your plant always with you
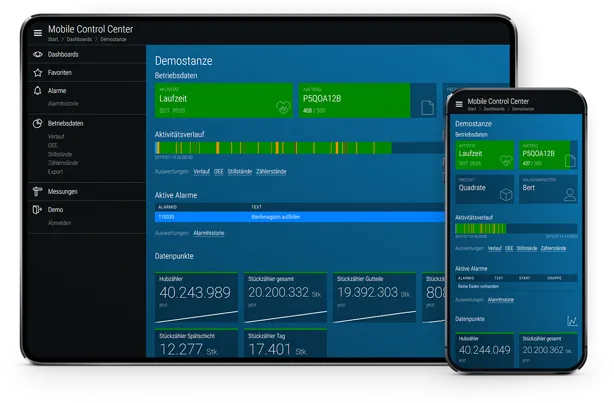
The user interface of control adapts to every screen, whether in the control room, on a tablet in the hall or on a smartphone on the move.
- Dashboards made of freely arranged tiles, with separate views for each user and task
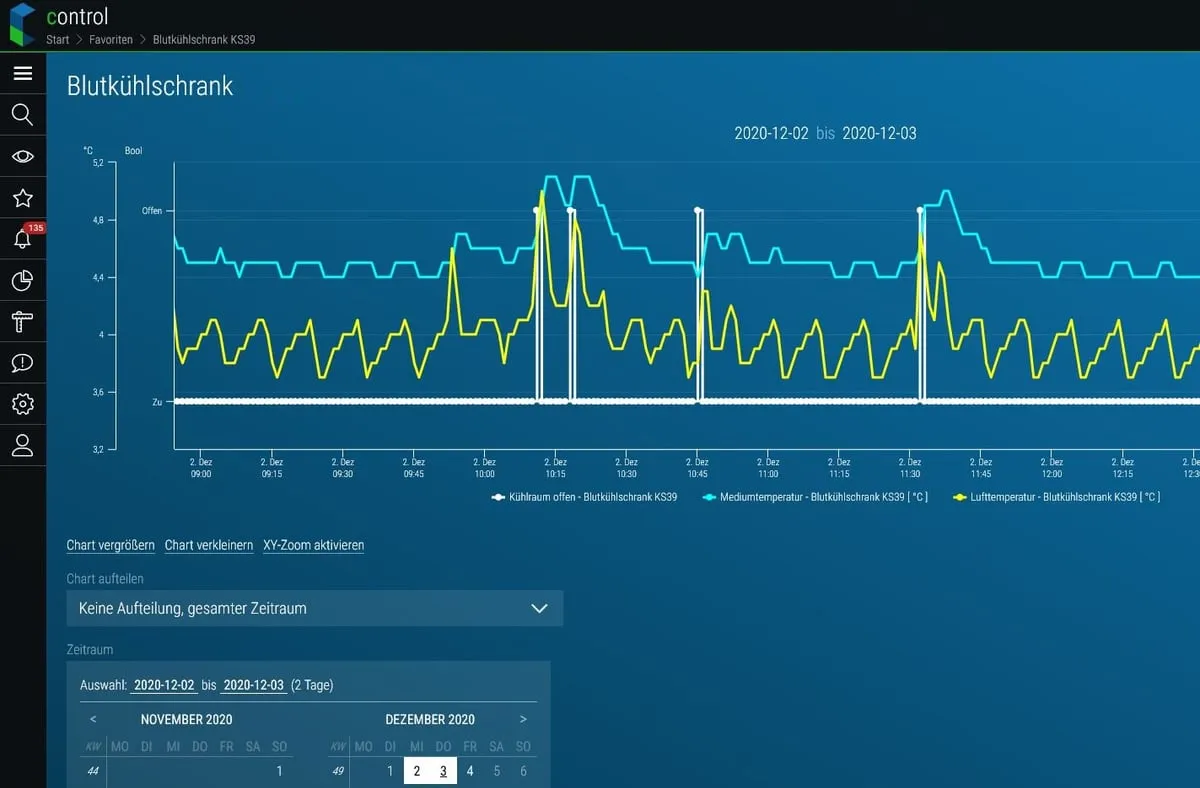
- Zoomable trends over any period, colours show the state at a glance
- Measured values organised in sets and favourites, with texts coming straight from the machine in the respective language
Alerting
Faults report themselves
control displays alarms and status messages in real time and records every event in a history, for troubleshooting as well as for audits.
- Notification by pop-up, SMS or e-mail, to different people depending on urgency
- Virtual alarms combining several values and summary messages for entire plant areas
- Alarms can be processed automatically according to a defined procedure
Operating data
Figures straight from the controller
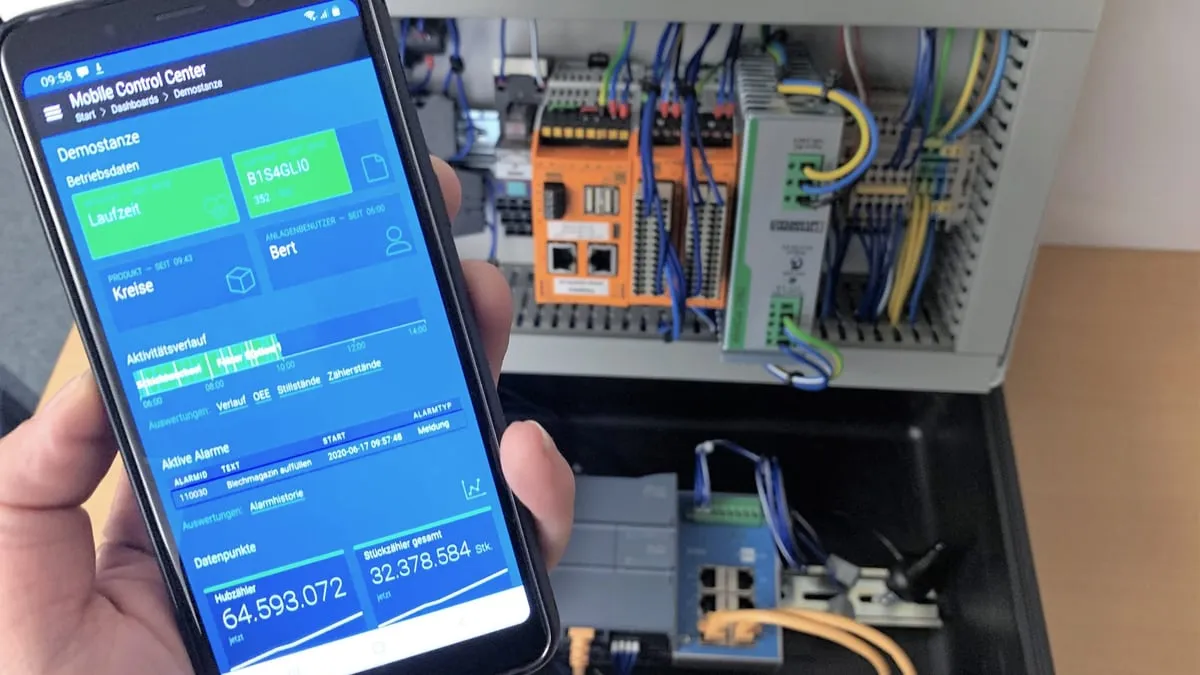
control takes piece counters, operating hours, cycle times, production and downtimes directly from the control level. The figures therefore match what was actually produced and are immediately available for work planning and post-calculation.
- OEE, good and rejected parts and downtime reasons calculated continuously
- Energy data and virtual operating hours counters for maintenance and cost accounting
- Data capture terminals or smart devices for manual input: order, quality, feedback, without paper or retyping
Analysis
From measured value to key figure
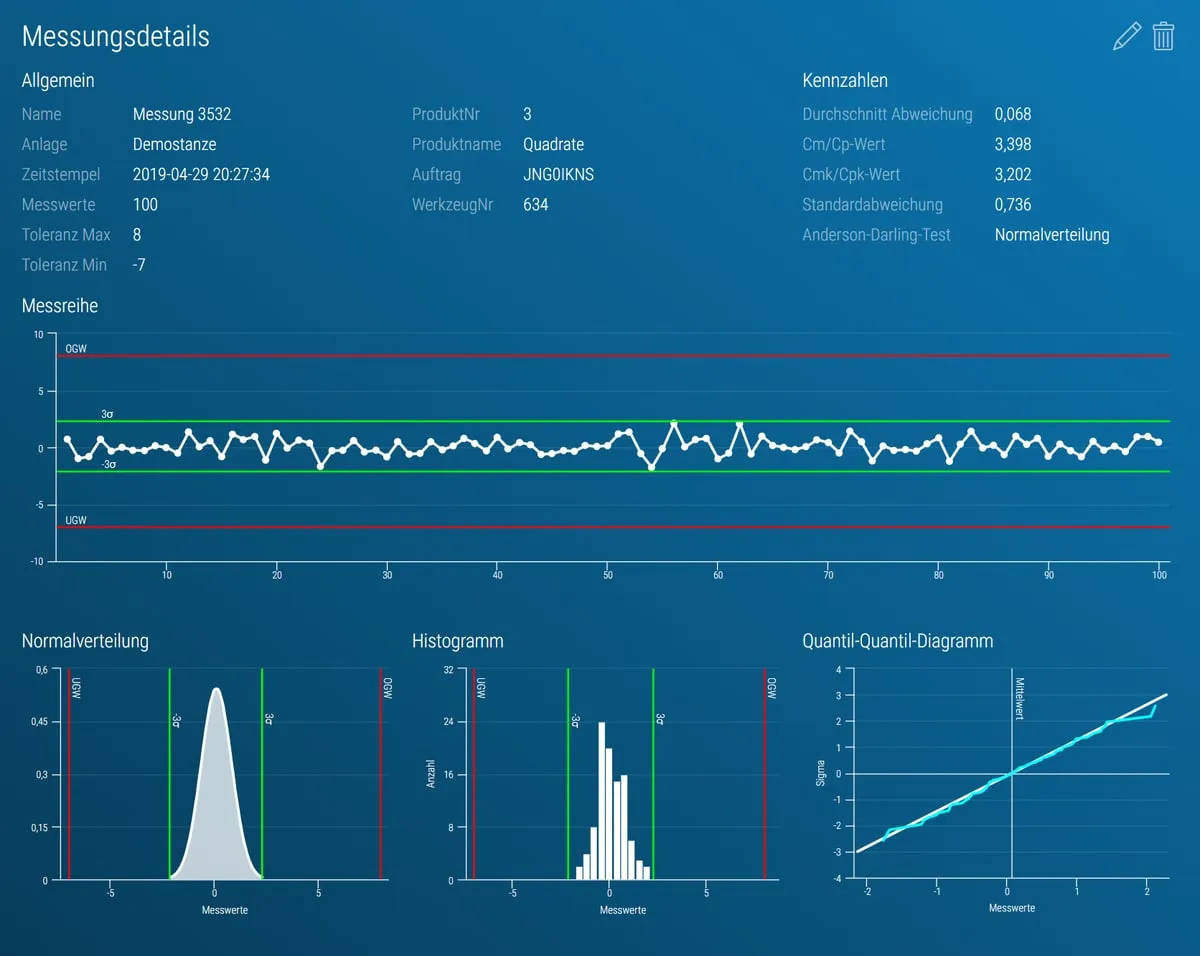
From the raw controller data, control calculates the key figures that production and quality assurance need. The summary is available online as a web report, and the data series can be exported for further processing.
- Utilisation, OEE and statistical values up to the standard deviation
- Minimum and maximum per data point including the time, for freely chosen periods
- Notes on anomalies and automatically created reports, for example per shift, day or week
Connectivity
Builds on what is already there
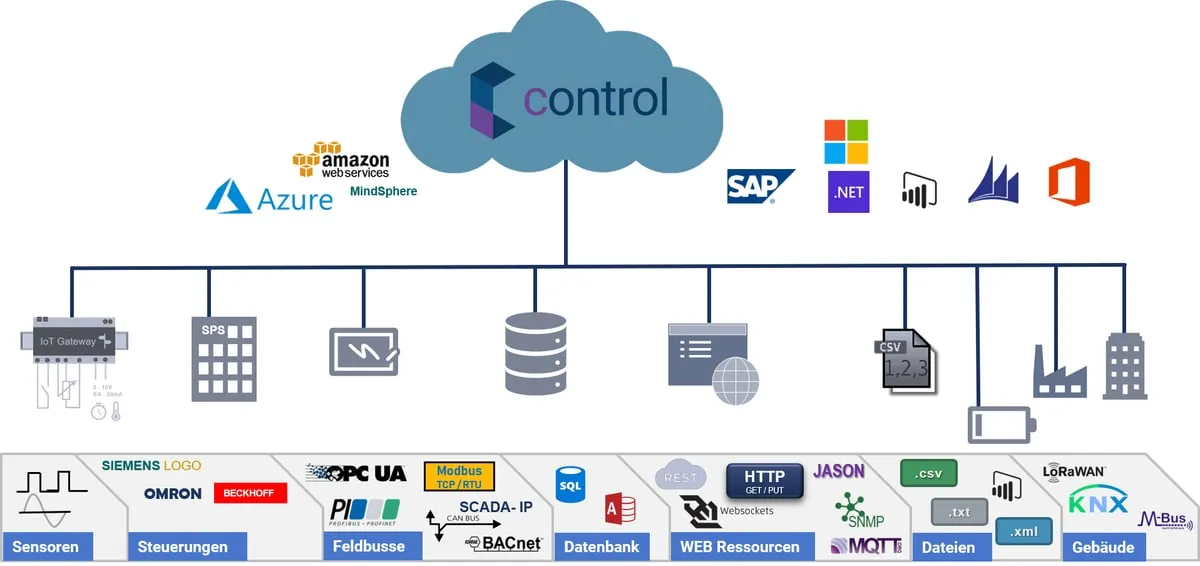
First we clarify with you which data is needed and where it already exists in your plant. What is there gets used: control takes values from control systems and PLCs directly. If a measuring point is missing, Eberle supplies the sensors, wiring and connection to the controller as well.
- Industrial protocols such as OPC UA, Modbus, MQTT, Profinet and TCP/IP as well as SQL databases
- CSV files, building services via KNX and wireless sensors via LoRa
- Microsoft Azure and web services for passing data on to other systems
Security and operation
Your data stays protected
Secured connection
Machine and cloud exchange data via VPN with certificate and 128-bit encryption, users access exclusively via HTTPS.
Rights by role
Finely graded user and role management: operators see their machine, production management sees all sites. Separate login per session, automatic logout when inactive.
Central archive
Data from controllers and plants is kept in a redundant database, protected against tampering. Storage is event-driven, and the update interval can be set per data point.
Local buffer
If the connection drops briefly, an on-site buffer, for example in the machine or the building, keeps the current values safe.
A service team runs the service around the clock. Because control runs in the browser, new developments are available to all users without an on-site update.
In practice
control in use
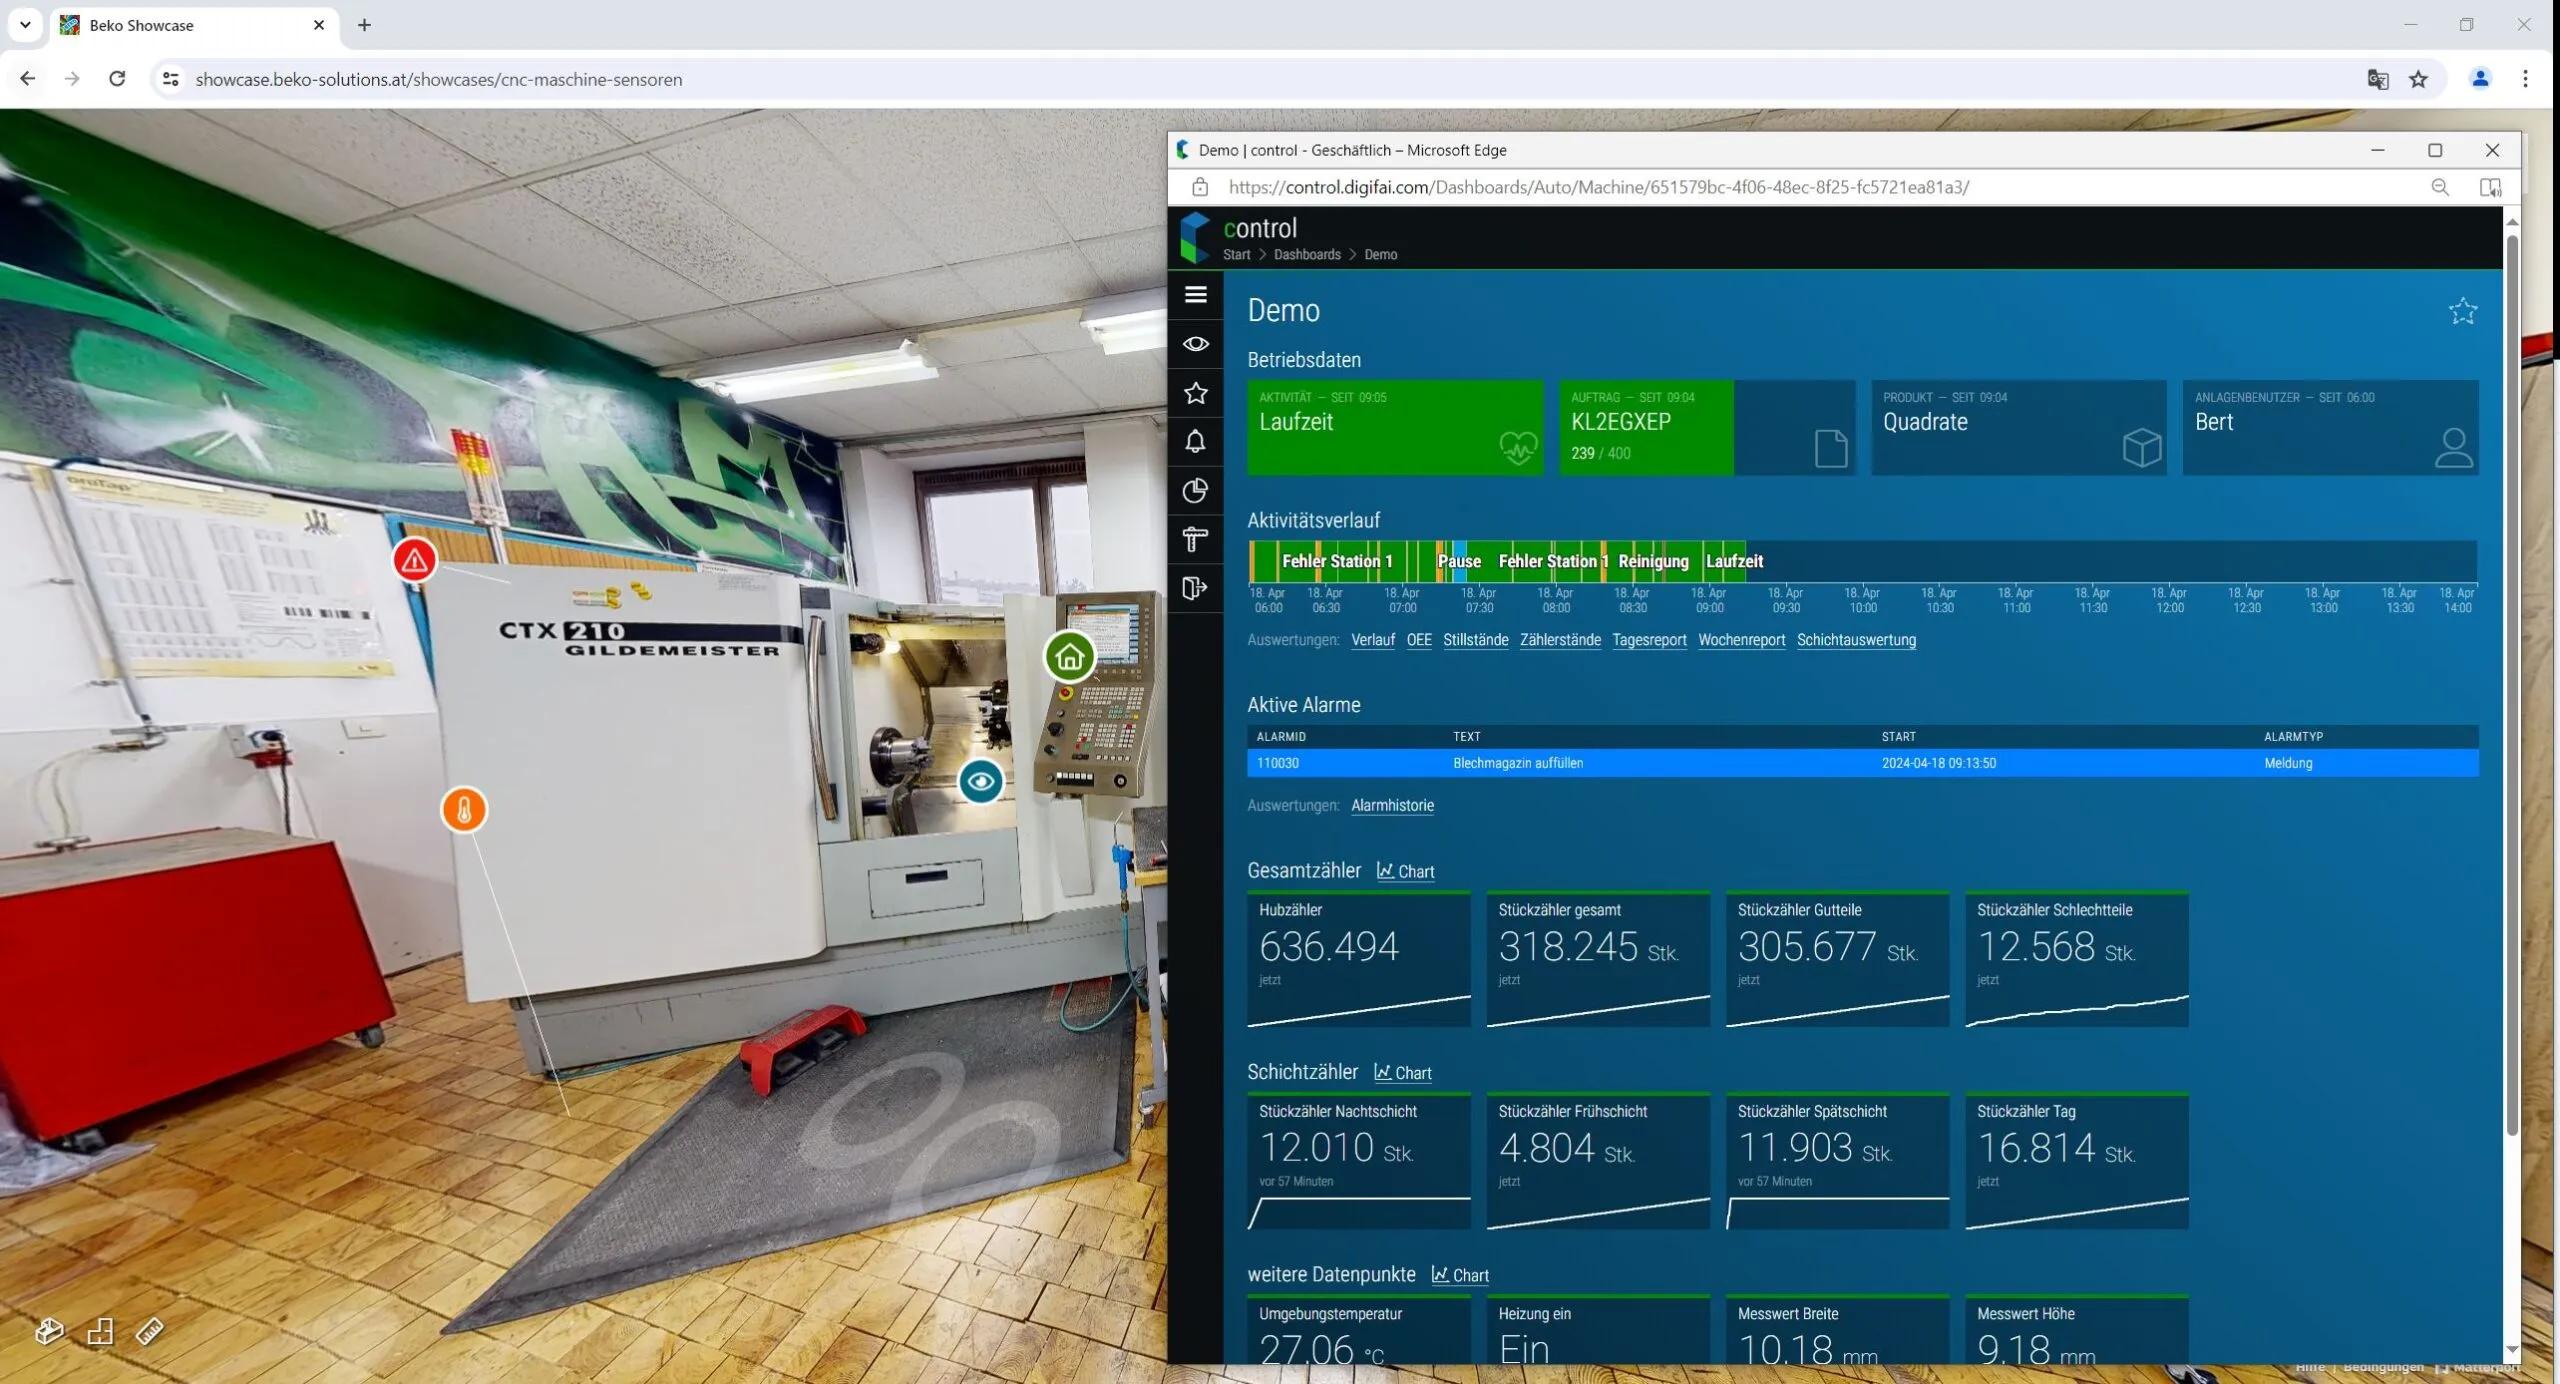
In BEKO's online showcase, a CNC lathe has been recreated as a virtual room using a 3D scan. The measuring points in the tour lead straight to the live data in control: operating state, order, alarms and counter readings.
Full article on digifai.com: online showcase with BEKO
Blood bank
At the Red Cross Vorarlberg, control monitors cold rooms and door contacts, raises alarms in two stages and documents everything.
Full article on digifai.com: blood bankCheese cellar
At the Bregenzerwald cheese cellar, climate, care robots and equipment at two sites come together on one platform.
Full article on digifai.com: cheese cellarSmall hydropower plant
At the Nesensohn plant in Laterns, the upper reservoir, penstock and turbine are networked, including pipe burst monitoring.
Full article on digifai.com: hydropower plant
You will find more projects under Projects, and how control works in control systems and SCADA solutions under process monitoring.
Frequently asked questions
What is control?
control is an IoT platform for industry. It collects process, machine and energy data from different sources, displays it in dashboards, reports faults and calculates key figures. Areas of use are production, energy monitoring and building services.
Does control also run on tablets and smartphones?
Yes. The browser interface of control runs on PC, tablet and smartphone and shows operating data, alarms and analyses.
Do I have to install anything?
No. control is provided as a cloud service (software as a service), access is via the browser.
Does control work with existing plants?
Yes. control takes data from existing controllers, control systems and databases, among others via OPC UA, MQTT, Modbus and SQL. Where a measuring point is missing, Eberle adds sensors and connection.
See control with your own data?
We will show you control with your own data sources, without obligation and without installation. We will gladly send you the product brochure on request. More information on control is also available from digifai.